Introduction
A few years ago, I decided to create a new Spotify playlist each month in order to capture my favorite music at various points in time. To keep each playlist consistent, I gave myself the following three conditions:
- the playlist would contain exactly 11 songs
- no two songs in the playlist could have the same artist
- every song in the playlist had to be a song I had listened to during the given calendar month
Between March 2018 and January 2022, I ended up creating 41
monthly playlists, which I have now combined into a
single 451-song playlist.
I chose this playlist as the corpus for my portfolio project because it represents the diversity of my music preferences, reflects month-by-month changes in how I listen to music, and can reveal long-term trends for how my taste in music may have changed over a period of four years.
Because of the long timespan of the corpus, time can be used as a variable to create and compare groups of songs. For example, I can compare the valence of songs I added before the COVID-19 pandemic to those I added during lockdown. I can also investigate how different seasons might affect my listening history – do I listen to more upbeat music in warmer months, or during the winter in an attempt to boost my mood? How has my appreciation for certain artists and genres changed month-by-month and year-by-year?
Since I almost exclusively listen to music on Spotify, I believe this corpus is highly representative of my personal listening habits. I also think the variation in songs will allow me to analyze certain tracks in greater detail. Songs like “2021” by A.G. Cook (a short, digitally-produced electronic track) will contrast greatly with “Obi Agye Me Dofo” by Vis à Vis (a 10-minute Afrobeat track recorded live in the 1970s). These songs fall on different sides of the spectrum in terms of length, genre, and “acousticness,” making them good candidates for investigation.
What musical features make songs sound similar?
Using the Spotify API, I analyzed some of the high-level characteristics provided by Spotify for the tracks in the corpus. Doing so brought to light some interesting relationships between these characteristics. Below is an interactive representation of some of those characteristics and how they are linked.
This scatterplot maps valence, energy, loudness, and acousticness for every track in the corpus. Using valence and energy on the x- and y-axis respectively, we can see an upward trend showing that higher energy tracks have a higher valence, meaning they are sound more positive to the listener. Using transparency as a fourth variable, we can see that higher energy/valence tracks are also louder, since the darkest points are in the top right quadrant of the plot. Finally, since size represents acousticness on this plot, it is clear that highly acoustic tracks have low valence and energy, since there are very few large points in the top right quadrant.
How closely do cover songs in different languages align?
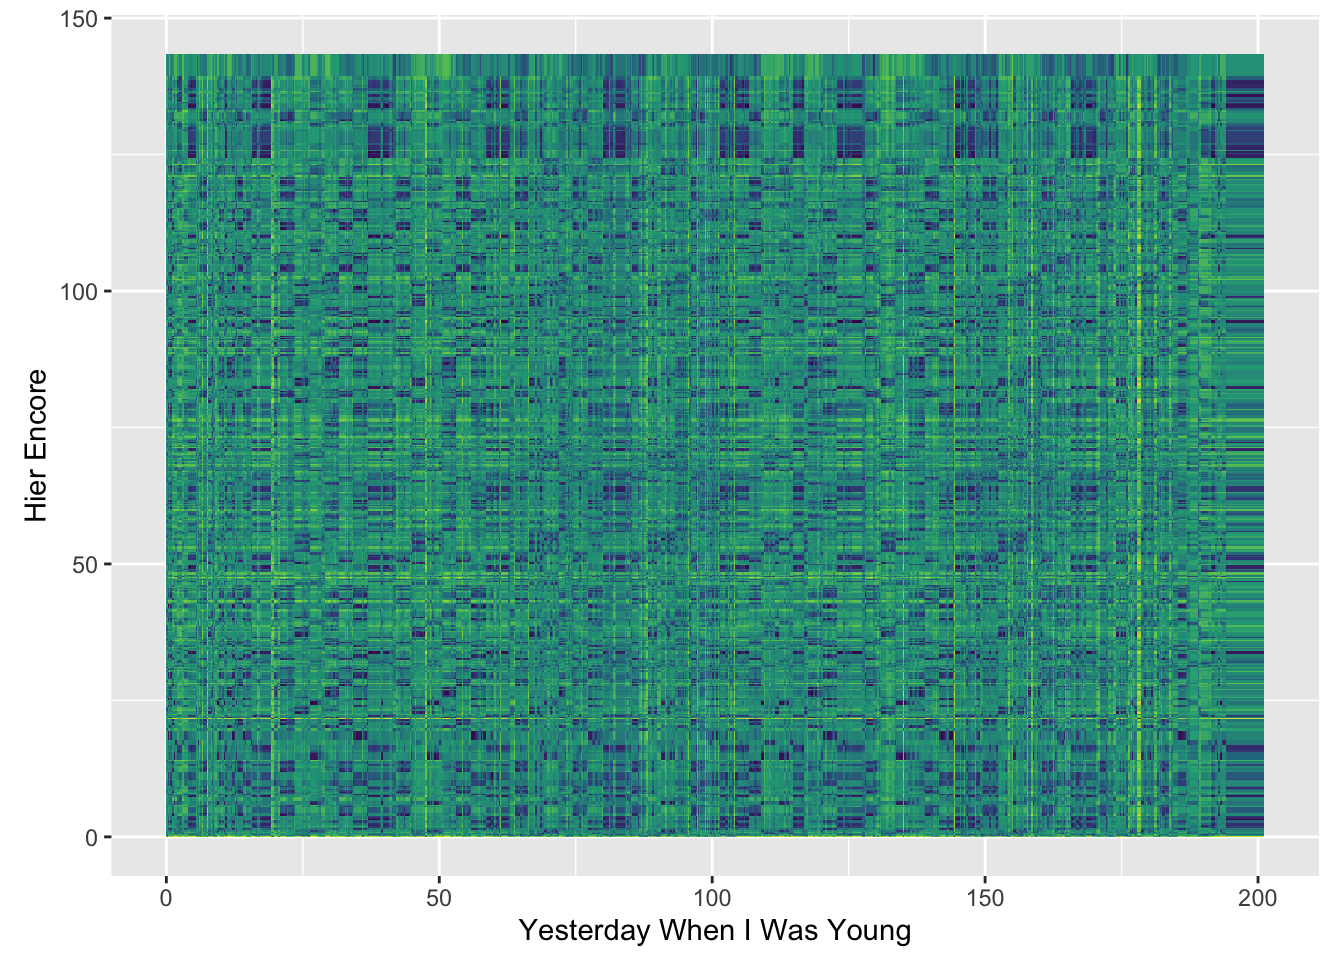
This plot represents a dynamic time warping between two versions of the famous French chanson “Hier encore.” The original version was released in 1964 by Charles Azvanour. Five years later, the American country singer Roy Clark recorded an English version of the song, titled “Yesterday When I Was Young.” Since these songs have different lyrics (sung in different languages) and employ different instrumentation, I wanted to investigate how musically similar the two songs really are. This plot shows the chroma features of each song, and similarity is shown by the several faint diagonal lines throughout the song. Although it is clear that the songs are not exactly the same (which would be shown by much clearer diagonal lines that have a slope of 1), we can see some similarities where chords are most likely aligning. Conversely, the parts of the plot where the lines become fragmented or broken probably represent parts of the songs where the chords does not align. This may be due to differences in key – some online research suggests that “Hier Encore” was recorded in D minor, while “Yesterday When I Was Young” was recorded in B minor. Azvanour’s decision to change the key might be ther reason why the two songs sound similar, but show differences when represented visually.
What makes a live performance unique?
As I looked through my corpus, I noticed that although most of my playlists’ tracks are studio recordings, I also included a few live versions of my favorite songs. To look for patterns in why I might prefer one over the other, I decided to investigate how musical features might differ between studio and live recordings of the same song. After creating visual representations to compare songs, I found that live versions of songs seem to fall into one of two categories. First, some artists choose to imitate a studio recording when performing live, creating a track that sounds very similar (but perhaps slightly different in timbre) to the original. I think this pattern is clearly shown by examining differences in tempo. For example, the tempograms below show side by side comparisons between the studio recording (on the left) and live recording (on the right) of “Foam” by indie rock band Diviño Nino.
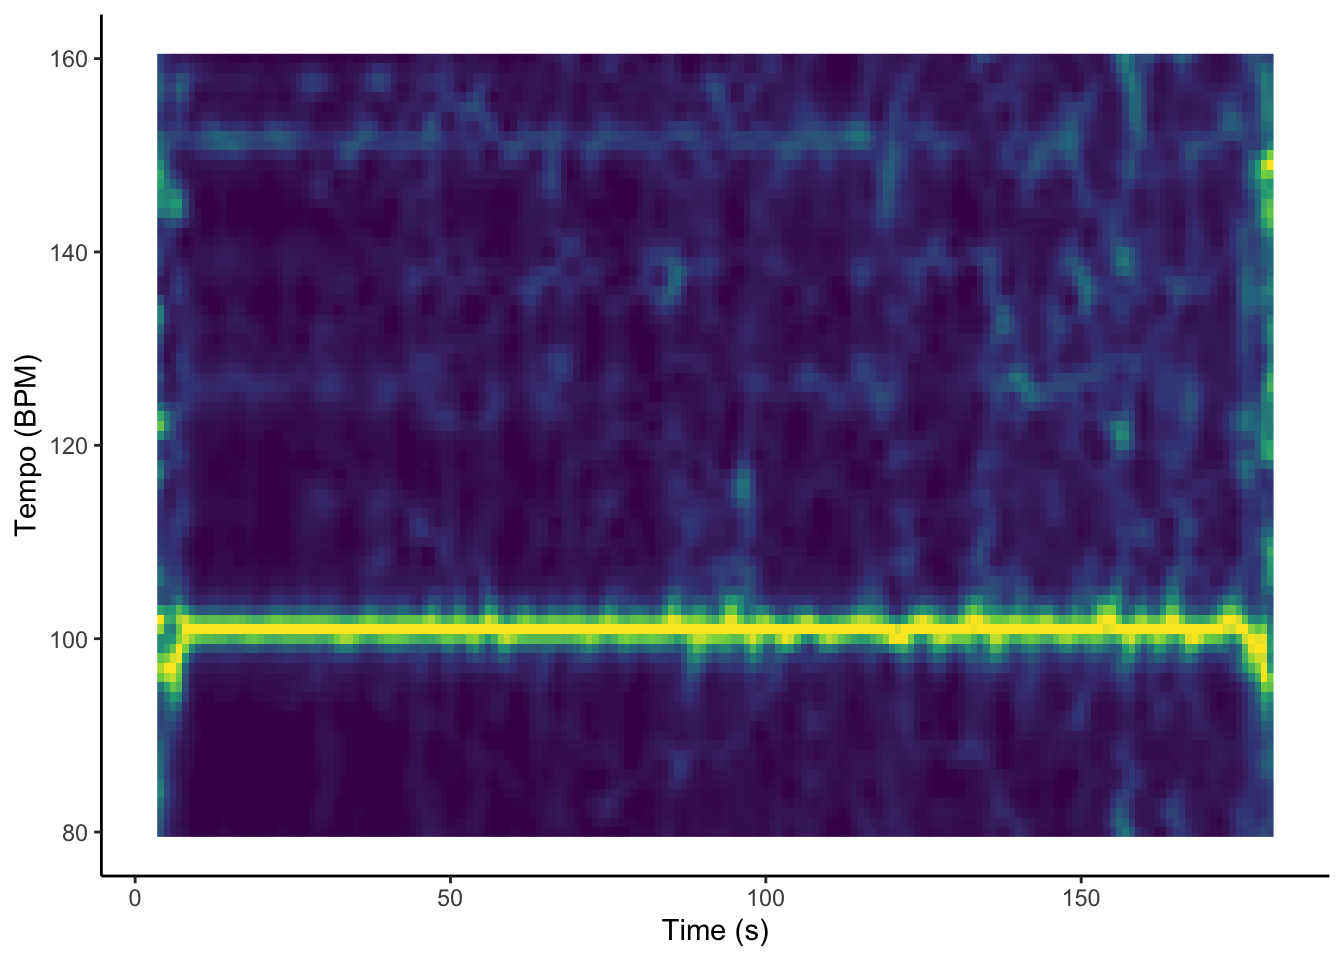
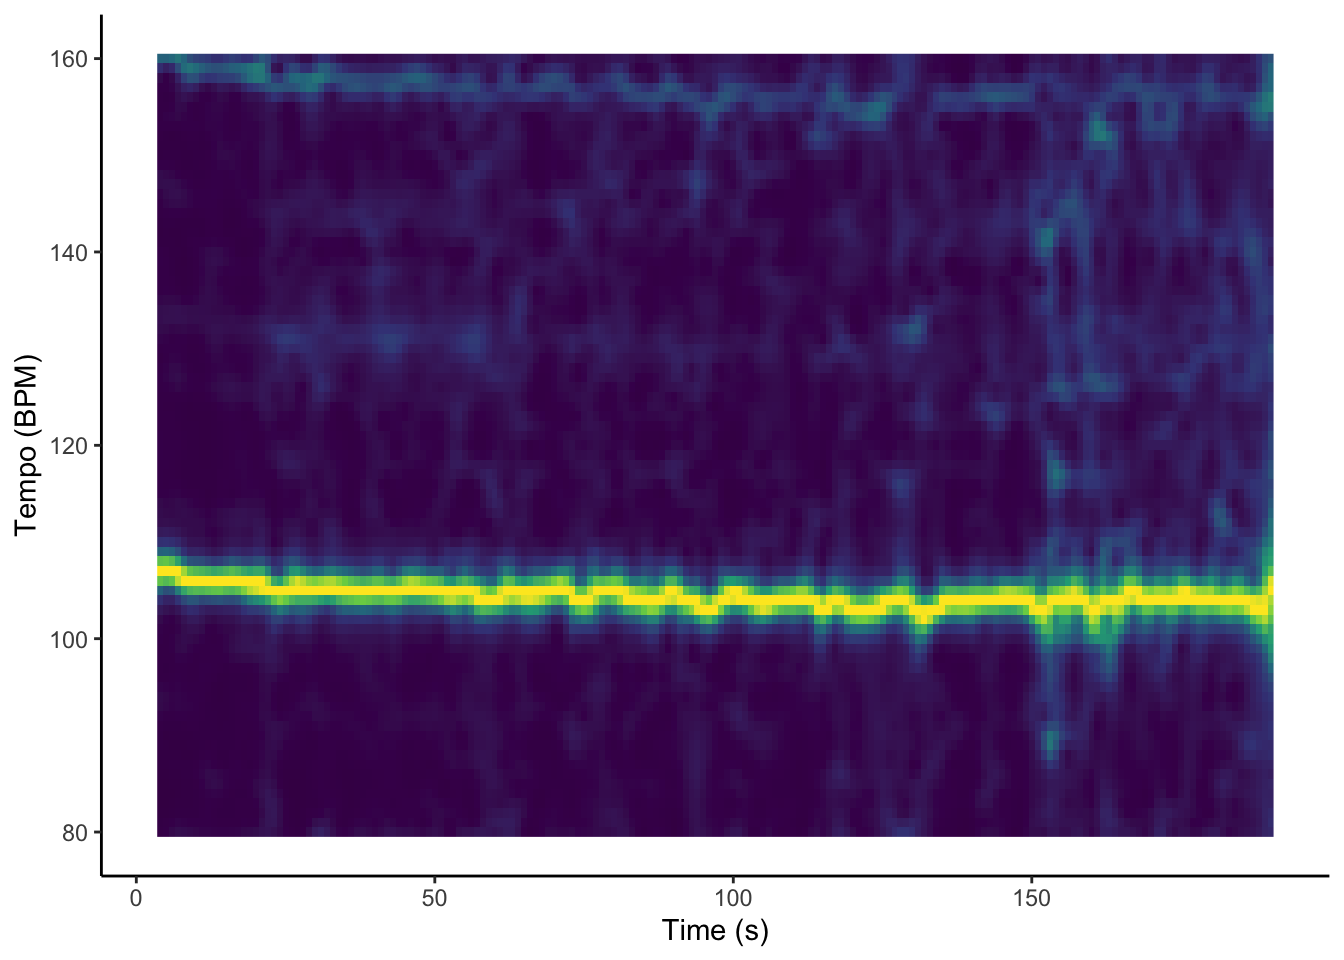
By listening to the songs and examining the tempograms, one can tell that the differences in tempo between both songs are minimal, with only slight fluctuation from 100 BPM. In contrast, some artists intend for their live performances to complement studio recordings by providing a completely different take on the original version. For example, Arctic Monkeys have totally transformed their sound since their debut album, shifting from energetic, punk-inspired rock to slow, jazz-influenced ballads. In 2018, they performed some of their older songs with their newer musical style. Below are two plots comparing the 2006 studio recording of “I Bet You Look Good On The Dancefloor” (on the left) with the 2018 live version (on the right).
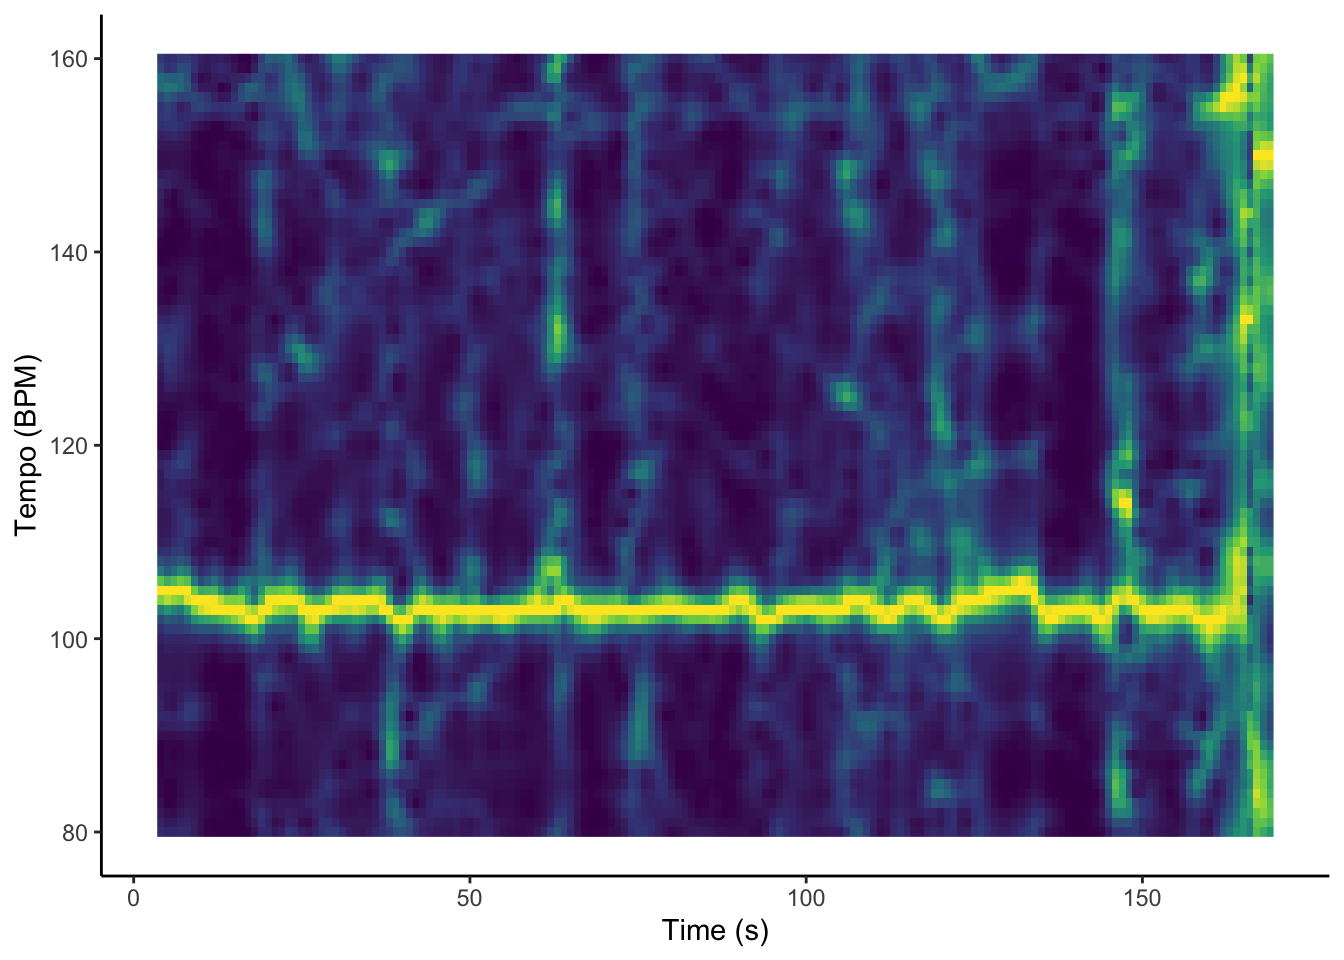
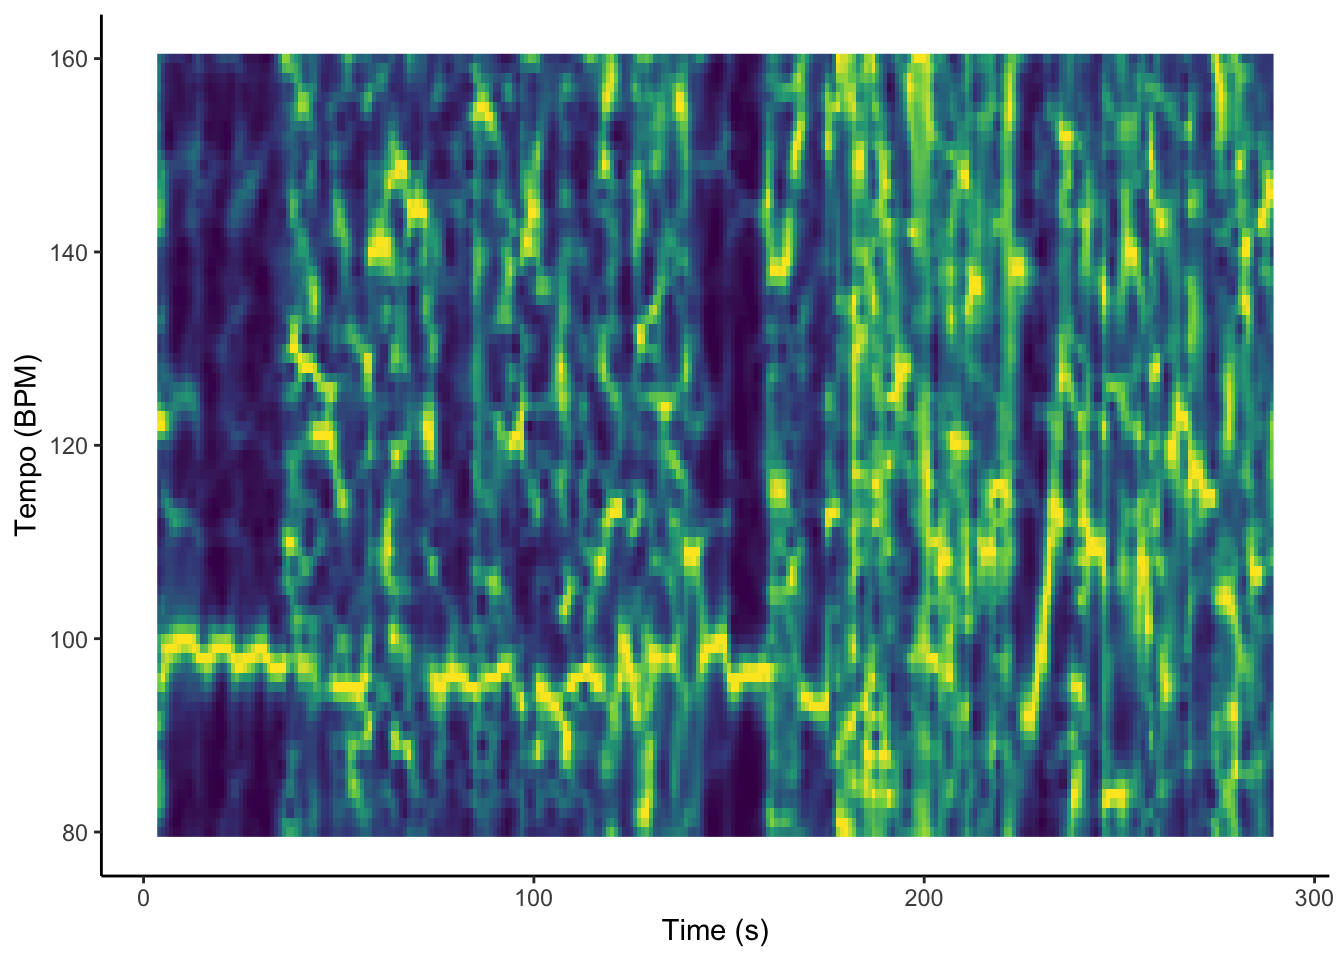
Clearly, there is a stark difference between these two Arctic Monkeys songs when compared to Diviño Nino. Instead of aiming to replicate the sound on their debut album, Arctic Monkeys wanted to perform their old songs with a new twist. The tempo in the live version constantly fluctuates between around 100 BPM (like the original) and 90 BPM. More significantly, the tempogram is unable to discern a single constant BPM throughout the live version. This indicates a lack of a consistent beat, which corresponds with the bands’ laid-back, more experimental style.
How do artists change their style over time?
The previous section highlighted the change in style between the Arctic Monkeys’ older and newer performances. We can see a similar evolution in sound in the music of Julian Casablancas, whose band The Strokes heavily inspired the Arctic Monkeys. Specifically, the visualizations below focus on how Casablancas’ use of key has changed over time.
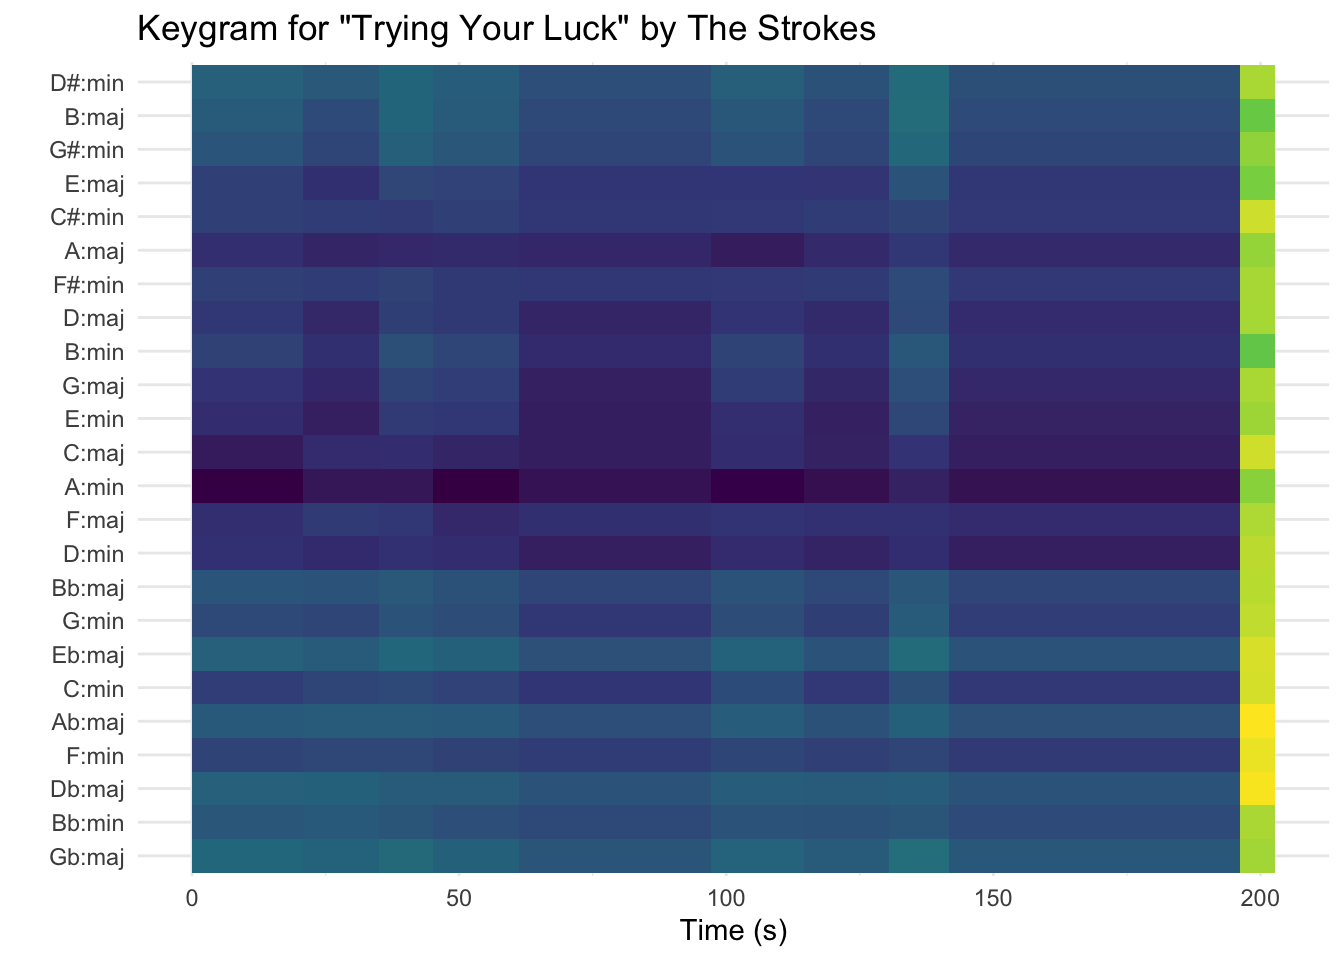
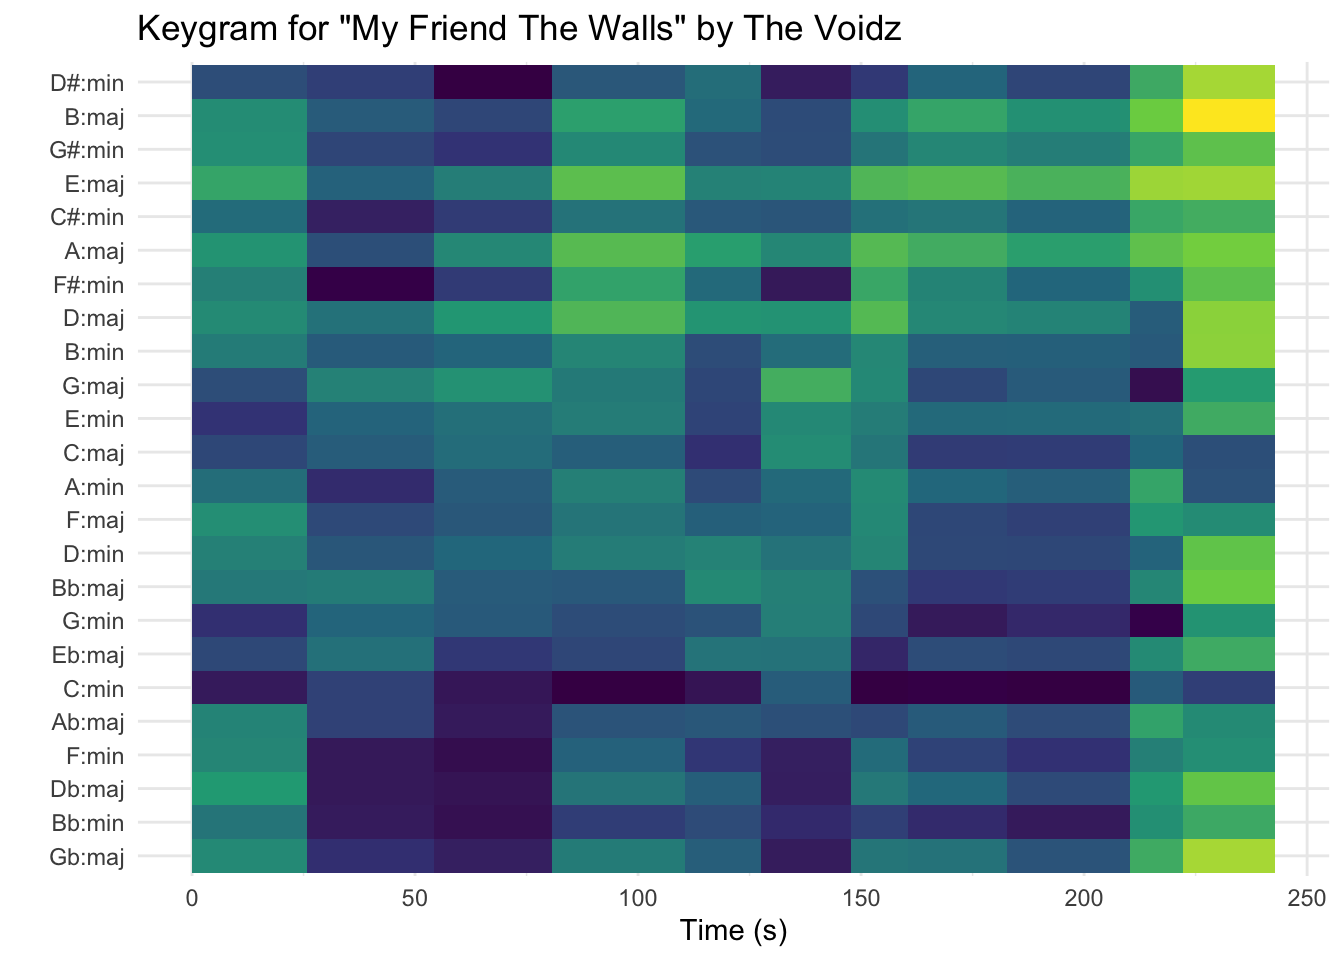
These two plots represent keygrams for songs from each of Julian Casablancas’ two bands: The Strokes and The Voidz. The first track, “Trying Your Luck,” comes from The Strokes’ 2001 debut album Is This It. “My Friend The Walls” is a track on Virtue, an album released in 2018 by Casablancas’ more experimental side project The Voidz. As a fan of both bands, I wanted to analyze how Casablancas’ music has become more experimental by looking at each band’s use of key.
When comparing the two keygrams, it is clear that “Trying Your Luck” uses a very consistent key (A minor), shown by the dark blue band that continues throughout the song until the last few seconds. Intuitively, the consistency of the key makes sense, since “Trying Your Luck” is a very simple song with no real change in mood or tone. The same few guitar chords are repeated in the verses and chorus. This was definitely an intentional choice, since much of the popularity of Is This It was attributed to its nostalgia-inducing simplicity.
In sharp contrast, “My Friend The Walls” is a complex, constantly shifting song that changes distinctly between each verse and chorus. We can see this on the keygram plot there is a higher level of uncertainty about which key the song is in and evidence of multiple shifts in key. Interestingly, most online sources claim the key of the song is actually G minor. The keygram shows a much more conflicting representation of constant shifts in key, with the most dominant key perhaps being C minor. I think this song exemplifies the more experimental and complex approach to songwriting that Julian Casablancas has developed over the past two decades.
How do timbre and pitch change during a song?
The previous sections examined how tempo and key inform the sound and mood of a musical piece. Other defining characteristics of a track are timbre and pitch. Below are visualizations of timbre and pitch for two pieces: “Bir Olasılık” by Erkin Koray and “Lies of Mercy” by the Durutti Column.
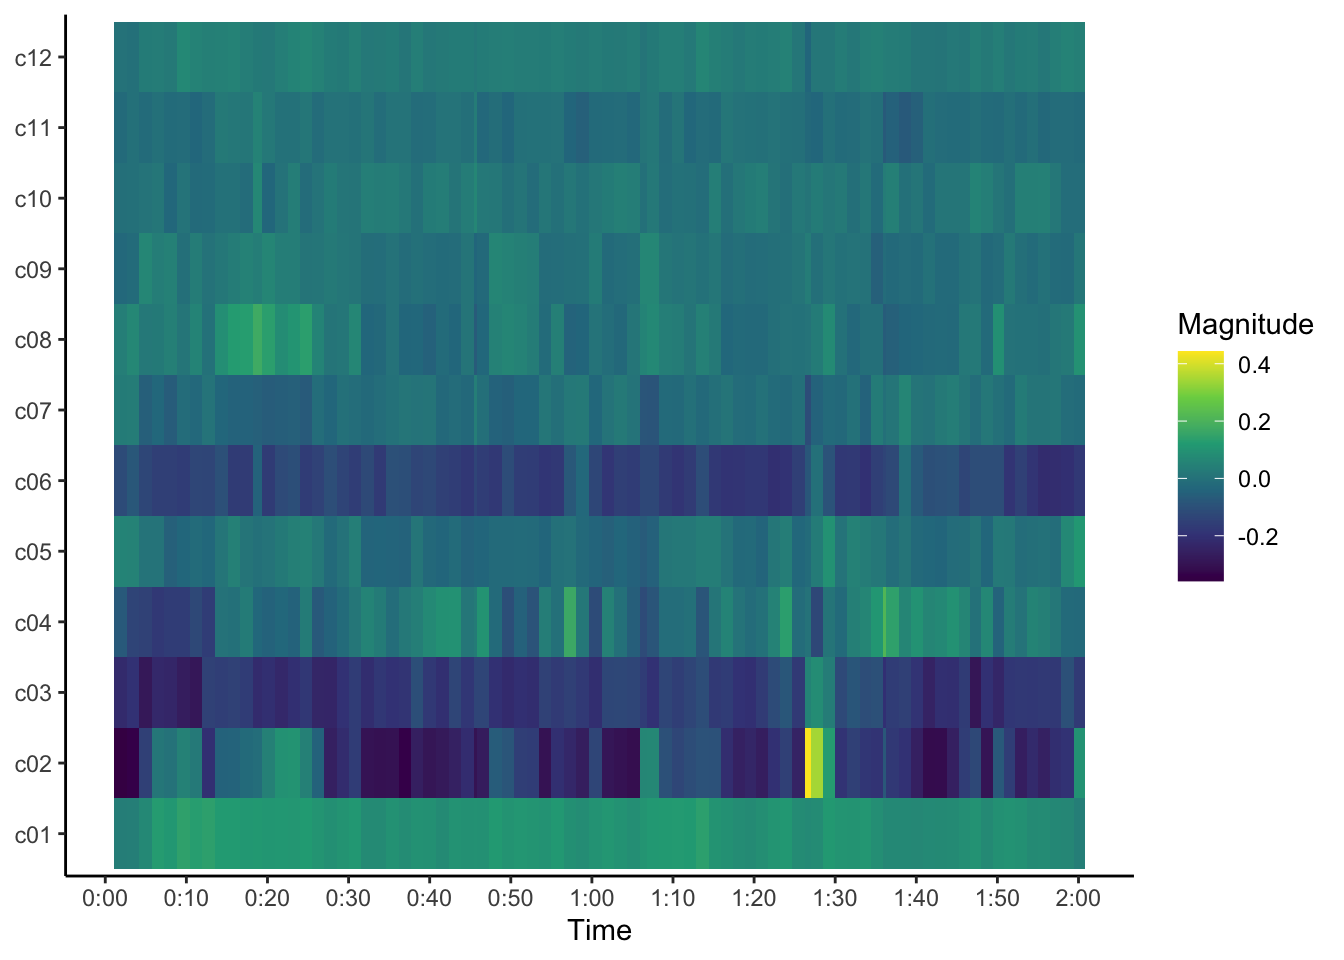
The visualization above is a cepstrogram that visualises the timbre of “Bir Olasılık,” an instrumental track by Erkin Koray. Since drums are the only instrument in this track, I thought it would be interesting to analyze how timbre changes thruoghout the song. As the plot shows, timbre stays relatively consistent in the C2, C3, and C6 rows, although there are parts in which certain timbres fade into the background or suddenly appear. One notable moment is around the 1:25 minute mark, where there is a bright yellow (high magnitude) section in the C2 row. This corresponds with a drum break that heavily features the cymbal, meaning the C2 timbre might correspond with cymbals or other drum components with similar timbre.
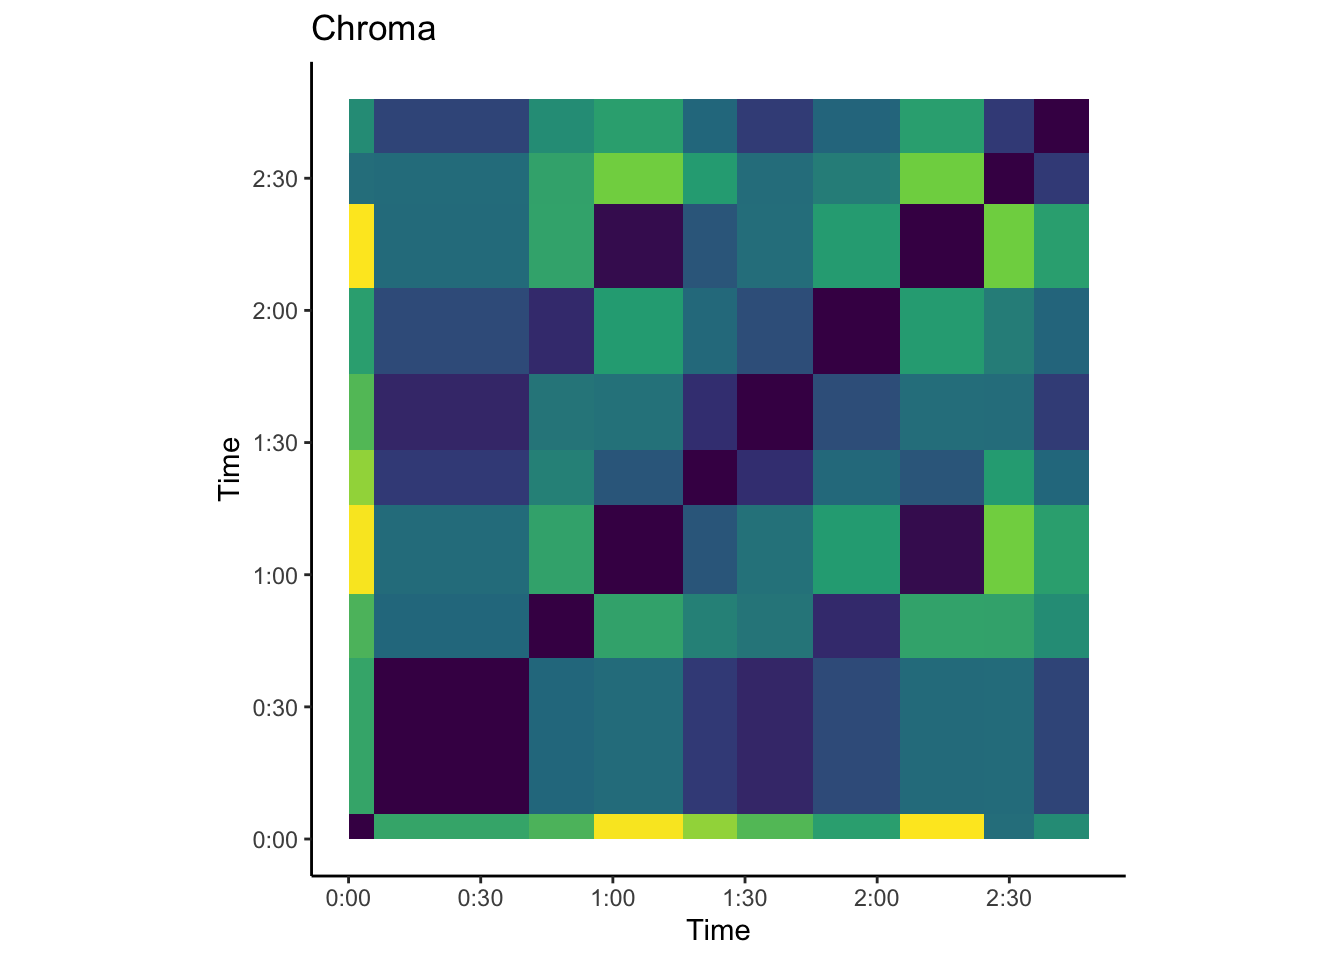
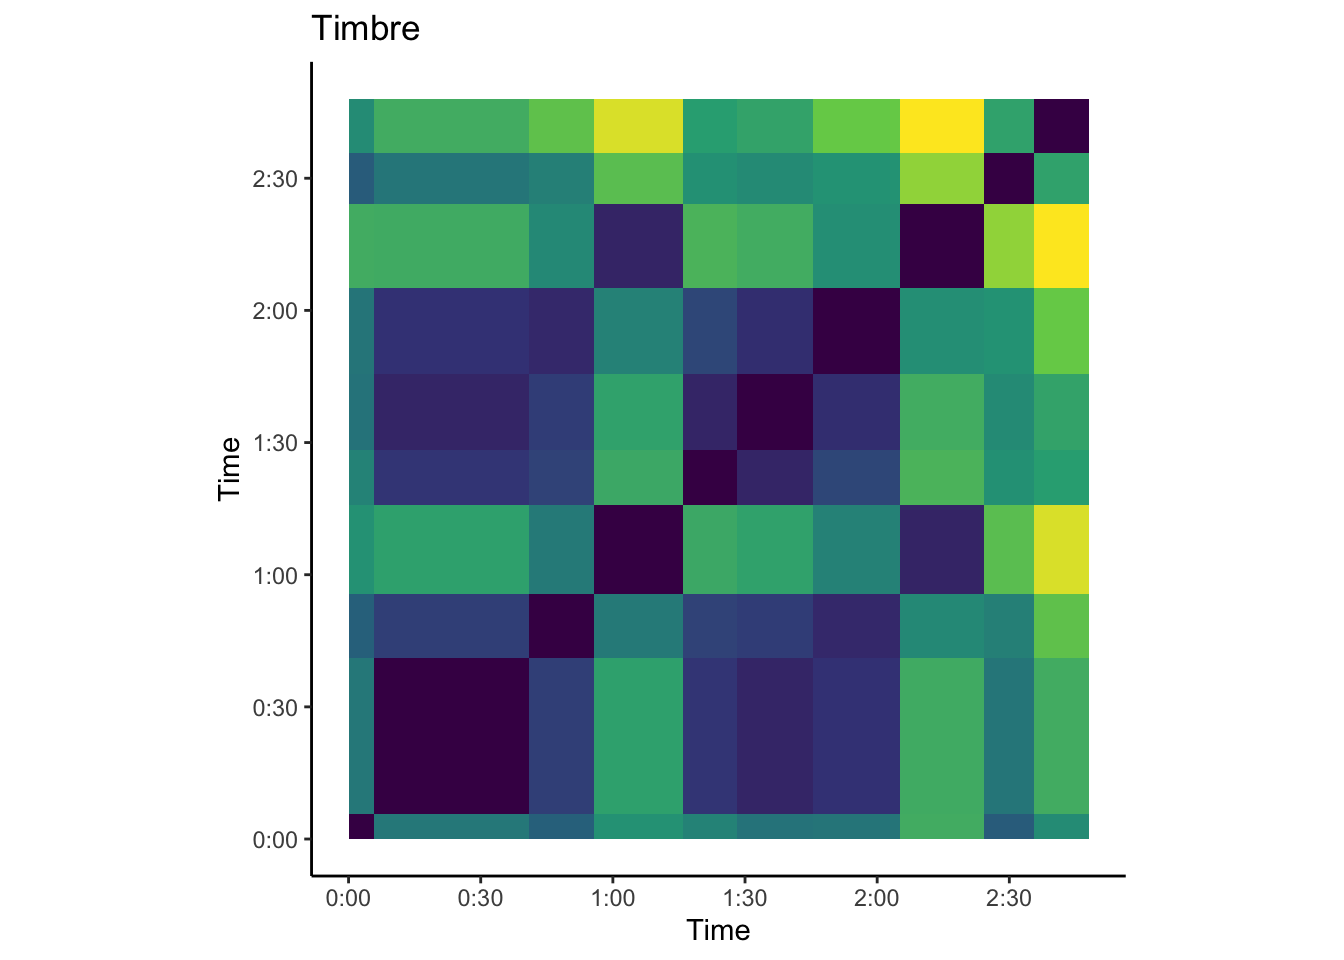
The two plots above represent chroma-based and timbre-based self-similarity matrices for the song “Lies of Mercy” by the Durutti Column. This song features a repetitive guitar riff that weaves in and out of the song. This track also has several distinct “sections” that correspond with chord changes. The timbre plot shows large chunks of similarity, since most of the song uses the same guitar and vocals. However, we can clearly see changes in the chroma plot for each of the sections. For example, the 40-second mark represents the change from the first verse to the chorus, and we see this change represented on the plot. There are also chunks of similarity (like the motif from 0:55 to 1:15, which repeats again at 2:05).
How can clustering reveal patterns of musical features?
The first section of this portfolio discussed the interplay of high-level features in the Spotify API (valence, energy, loudness, and acousticness by track). Through clustering – represented visually using a dendrogram – we can develop clusters of similar tracks, based on similar high-level musical characteristics.
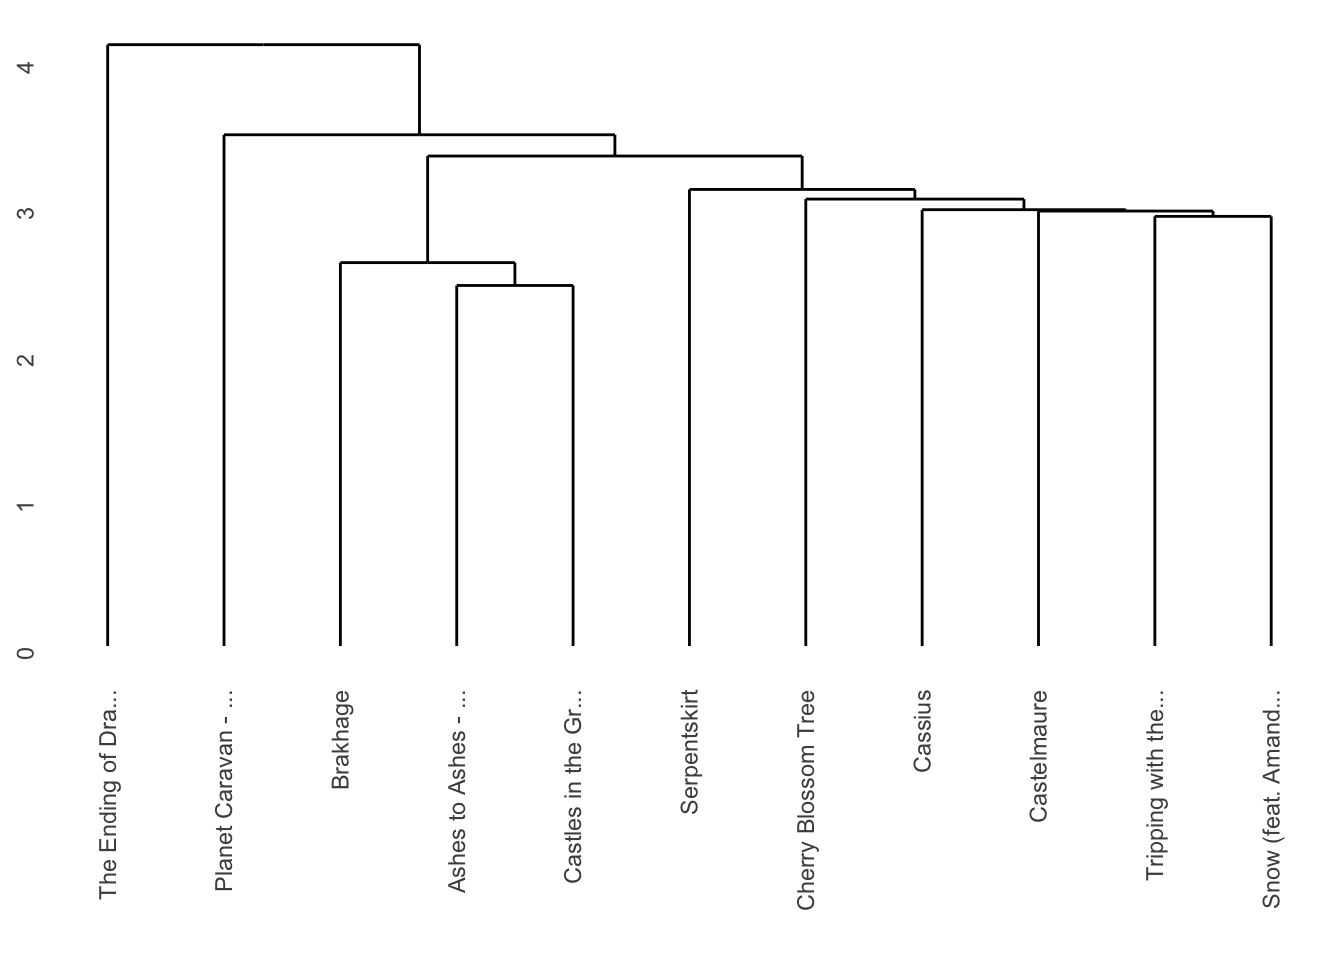
This plot is a dendrogram of tracks from May 2020 of my corpus. Since these 11 tracks were added to my corpus during one of the most restrictive periods of COVID-19 lockdown, I wanted to see if there are any patterns in my listening history that reflect the slower pace of life while staying at home. This dendrogram uses Euclidean distance and average linkage to show hierarchical clusters of tracks using various Spotify features. Certain features (like duration and tempo) are too general to reflect meaningful patterns in my listening preferences. However, focusing on individual tracks reveals how these features influence clustering. For example, “Ashes to Ashes” and “Castles in the Grave” are high in tempo and low in acousticness, while “Snow” and “Planet Caravan” are slower, more low-key tracks that share similar valence, energy, and danceability.
Conclusion
The scope and variety of my corpus allowed me to dive into how my preferences have remained and changed over the years. By looking at tracks, artists, and playlists over time, I was able to use Spotify’s API to examine both high-level and low-level musical features. Overall, my most important takeaway is that simply listening to music allows me to intuitively come to conclusions about what I like and dislike, whether or not this is always consistently backed up by data. I think this points to the subjectivity of musical enjoyment, and the need for more research to truly understand why I enjoy the music I do.
Opportunities for further analysis could include additional work on determining and visualizing clusters. It would also be interesting to examine how accurate these clusters are, and to see which high-level features lead to the most accurate dendrograms and clusters. I would also like to delve more into how the corpus can be examined over various spans of time. For example, additional research into how my music preferences have changed over time would . Finally, although this is beyond the scope of my current abilities, I would like to predict how my music listening trends will inform my favorite music of the future. What will this corpus look like in a year? Which new artists, genres, and tracks will pop up on my radar? Whether or not I answer these questions, my work on this portfolio has truly increased my awareness of the complexity of how music is created, performed, listened to, and enjoyed.